The “SEO Dashboard” Method: How to Set Up Your 30-Day Audit in Semrush

The “Is This Thing On?” Phase
We have covered a lot of ground in this series. We’ve acquired an aged domain, built the mini-site, created a content blueprint, and even started our link outreach.
Now, we enter the hardest phase for any investor: The Waiting Game.
You log into Ahrefs or Semrush, and you see “0 Traffic.” You panic. You wonder if you picked the wrong niche or if the domain is broken.
But “waiting” isn’t a strategy. Measuring is.
The problem isn’t your site; it’s your metrics. In the first 30-90 days (the “Google Sandbox” period), standard traffic metrics are useless. You need a different dashboard.
In this guide, I’ll show you my exact workflow for setting up a 30-Day Audit Dashboard using Semrush. We will look beyond the “0 traffic” and set up the only metrics that actually matter for a new site: Visibility % and Search Intent.
Step 1: The “Day 1” Technical Baseline (Site Audit)
Before we track a single keyword, we must ensure our foundation is solid. An aged domain can carry “technical debt”—old broken links, redirect chains, or crawl errors from its previous life.
Tool: Semrush Site Audit.
I ran a fresh audit for sunnynorthdigital.com.
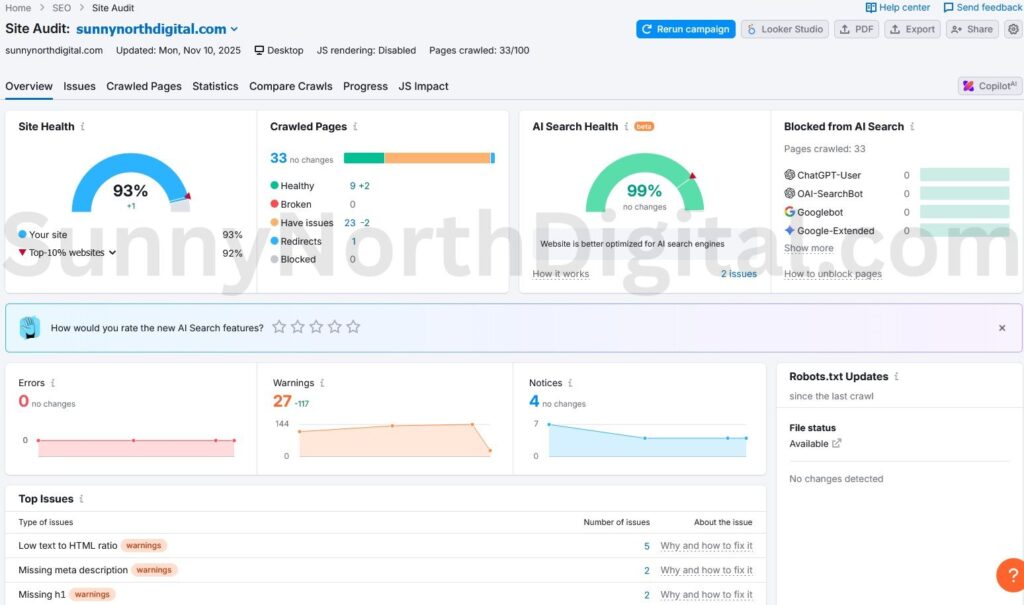
Analytical Insight: My audit came back at 93%, which is a great baseline (my goal is always 92%+).
However, it’s not perfect. The audit flagged “5 pages with low text-HTML ratio” and “2 pages missing meta descriptions.” Before I panic about rankings, I need to fix these basic on-page issues. For an aged domain, always check the “Redirects” count (I have 1) to avoid chaining old URLs and confirm your 301 redirects are set up correctly.
Step 2: How to Set Up Position Tracking in Semrush
This is the engine of our audit. Unlike standard “organic research” which lags by weeks, the Position Tracking tool updates daily.
Tool: Semrush Position Tracking.
Here is my setup workflow:
- Create Project: Go to the Position Tracking tool and create a new position tracking campaign for your domain.
- Select Search Engine: Choose Google (Mobile) as your primary search engine device target, as mobile-first indexing is the standard.
- Add Target Keywords: This is crucial. Do not just dump every keyword you found. I manually add the 10-15 “pillar” keywords I specifically wrote content for (e.g.,
best domain auction sites,ahrefs domain analysis workflow).
Why do this manually? If you rely on auto-discovery, the tool might track irrelevant keywords. By manually entering your target keywords, you create a clean dashboard that tells you exactly how your specific strategy is performing.
Step 3: Analyze the “Day 1” Metrics (The Core Insight)
Once the Position Tracking tool runs its first scan, you’ll get your “Day 1” dashboard. My report, for example, shows a 9.23% Visibility Score, which at first glance looks great.
Analytical Insight: Don’t Be Fooled by Vanity Metrics
Let’s look at the data. My Visibility Score is 9.23%.
Don’t be fooled by vanity metrics. If I dig deeper into the keyword report (as seen in the screenshot above), I can see that almost all of this visibility (9.09% of it!) comes from my site ranking #1 for its own brand name, sunnynorthdigital.com.
For my actual money keywords—like best domain auction sites or how to build links—my visibility is 0% (indicated by the dashes -).
This is normal. I am in the “Google Sandbox.” My strategy isn’t to stress over the 0%. It’s to watch for that first sign of life—a jump to position 90, then 50. My goal for the next 30 days is simply to see those dashes turn into numbers.
Ignore the “Estimated Traffic” metric—it will be zero. Ignore the daily rank jumps (the “Google Dance”). The only metric that matters is the Visibility % trend line for your non-branded, target keywords.
Step 4: Cross-Reference with “Ground Truth” (GSC)
Semrush is excellent, but it is a third-party tool. To get the complete picture, we must layer in Google Search Console (GSC) data.
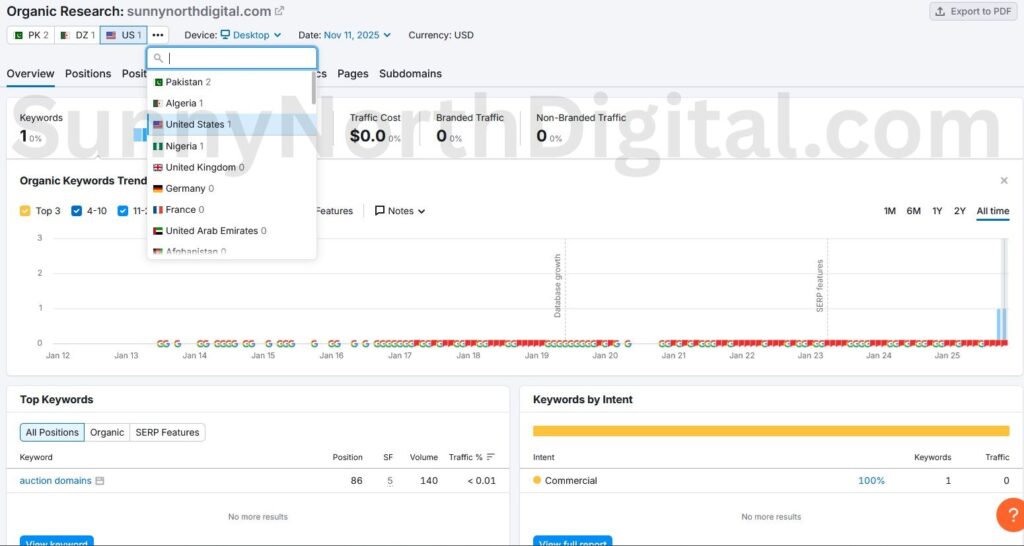
I noticed that Semrush’s Organic Research tool only showed 5 keyword rankings for my site.
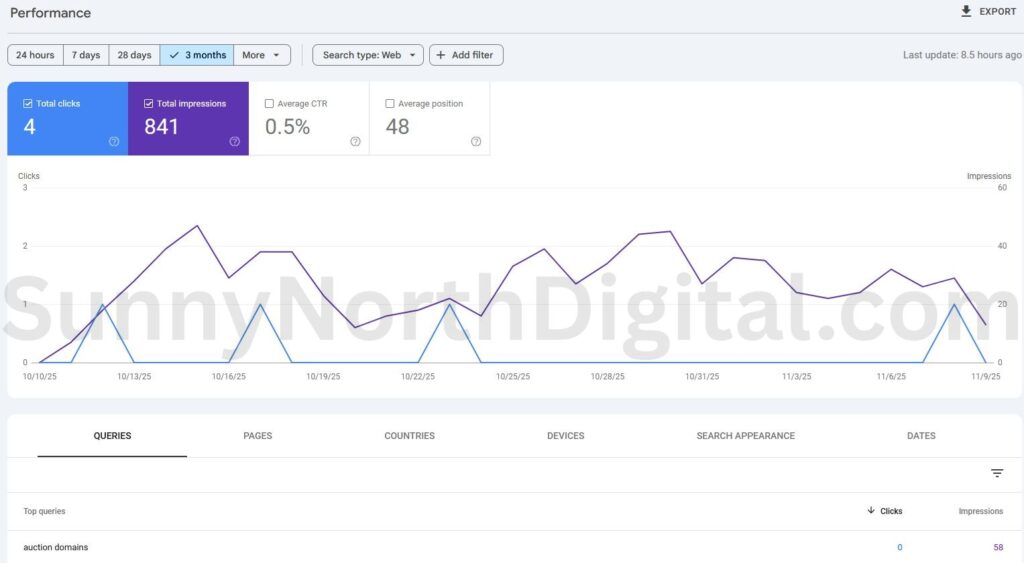
However, when I look at my GSC Performance report, the story is completely different.
The Expert Feedback Loop: This discrepancy is an opportunity. GSC shows me keywords that Google already thinks are relevant (like google penalty checker).
Post Insight: This is the expert’s feedback loop. Semrush shows me one clear win: my post on how to monetize expired domains has entered the top 100 at Position 47. This is a ‘striking distance’ opportunity!
Google Search Console confirms this trend, showing impressions for related terms like domain flipping and auction domains.
Actionable Step: I now know that Google likes my monetization content. I will go back to my Semrush Position Tracking and ensuring all variations of ‘monetize expired domains‘ are being tracked, so I can monitor this specific topic cluster’s rise to Page 1.
I will take these “high-impression” keywords from GSC and add them to my Semrush Position Tracking campaign. This “closes the loop,” ensuring my Semrush dashboard tracks the actual terms driving visibility, not just the ones I guessed at.
Trust the Trend
Building a mini-site on an aged domain is a long-term play. In the first month, “Traffic” is a vanity metric that will only discourage you.
By setting up this SEO Dashboard, you shift your focus to the metrics that matter:
- Site Health (via Site Audit).
- Visibility Trend (via Position Tracking).
- Real-World Impressions (via GSC).
This workflow ensures you aren’t flying blind. You have the data to prove your content strategy is working and the insights to guide your next round of link building.
Monitoring your dashboard is critical, but data without action is useless. If your 30-day or 90-day trend shows a flatline, you need to take action. Learn how to update old blog posts for SEO to break through that plateau.